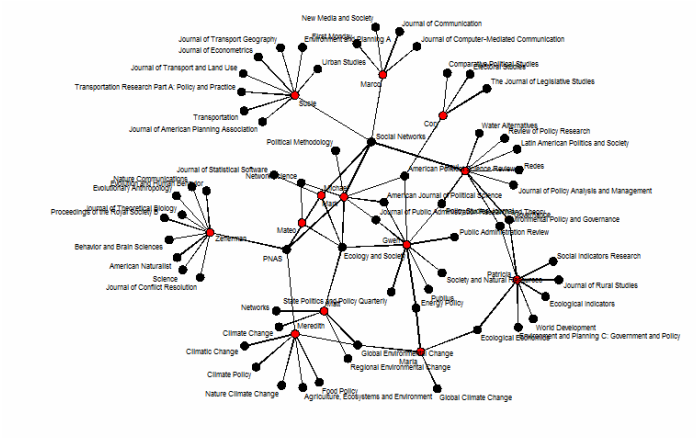
Michael Levy of the Center for Environmental Policy and Behavior at UC Davis created a bipartite network of using his coworkers and their preferred journals to illustrate the functional clusters within the highly interdisciplinary lab. He then converted the visualization into a single mode network using ggnet – a ggplot implementation (via the GGally package) and calculated degree, betweenness, and eigenvector centrality for each journal for a more detailed picture of the overlapping interests within his community. He provides his r code for anyone who wants to apply try the excersize with their own lab.
Check out Michael Levy’s blog to read more and play with his code : http://environmentalpolicy.ucdavis.edu/blog/2015/03/386